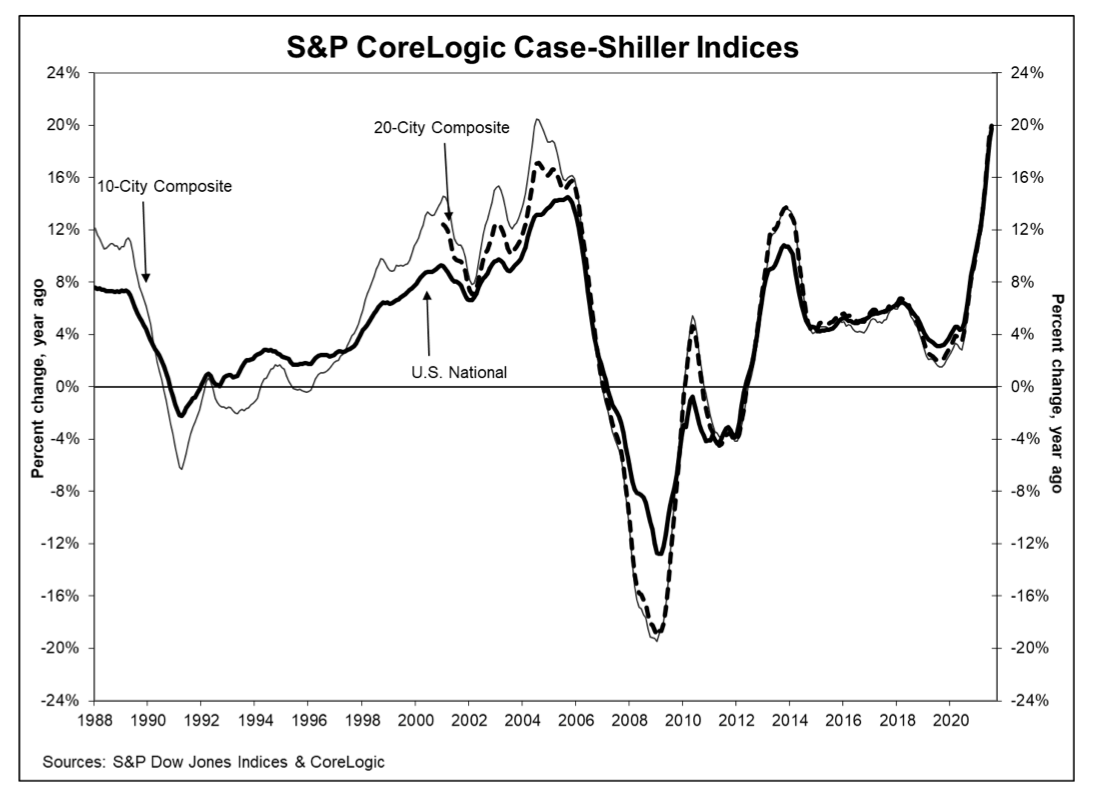
American real estate prices have been growing at one of the fastest rates on record. The S&P CoreLogic Case-Shiller U.S. National Home Price Index for July, was released today. The series of indexes shows monthly and annual prices are still showing very strong growth. While it might seem like home prices are getting out of control, they’ve only made modest gains since the 2006 bubble peak.
US Home Prices Showed Smaller, But Still Large, Monthly Growth
Existing home prices are showing substantial gains, but some signs the market is starting to cool. The seasonally adjusted monthly increase of prices at the national level reached 1.5% in July. For the 20-City Index, representing the 20 largest markets, prices increased 1.5% over the same period. In the 10-City index, the increase was 1.4% compared to a year before. All three measures show a tapering of growth from the previous month, a sign of the market calming. At least a bit…
US Home Prices Have Been Growing At One of The Fastest Rates On Record
Annual home price growth continued to accelerate to the highest rate ever. Unadjusted national home prices showed an annual increase of 19.7% in July, smashing the previous record set a month before. The recent boom makes the 2006 bubble look like a calm and reasonable market by this measure.
The urban indexes also showed strong growth, with one even outpacing the national boom. The 20-City Composite showed annual growth of 19.9% in July, up from 19.1% in the previous month. Similarly, the 10-City Composite posted annual growth of 19.1%, up from 18.5% over the same period. Overall, this highlights strong growth in smaller cities.
A Typical Home Bought After The Crash Is Now Worth Double
The US home price index shows home prices have nearly doubled since the market’s bottom. The national index is 98% higher than it was at the bottom in 2012. Similar trends can be seen in the 20-City Composite (103.1%), and the 10-City Composite (94.4%), over the same period. Buyers that nailed the purchase date hit a home run.
A Typical Home Bought At The Bubble Peak In 2006 Made Modest Gains
Buyers at the peak of the US housing bubble didn’t quite do as well. The national index is up 43.7% from the 2006 peak, which is a compound annual growth rate of 2.45%. Not huge gains, but it could be worse — they could have left it in a savings account.
Urban indexes show much smaller growth than the national level. The 20-City Composite has grown 31.9% since the peak in 2006, while the 10-City composite is 25.8% higher. Considering growth tapers as the indexes focus on larger cities, shows smaller cities are where the growth is these days.
Slower monthly price growth is a trend worth watching, even with annual acceleration. The annual perspective is somewhat skewed due to the odd pandemic movements. However, even with the monthly slowdown, price growth is still very large.
Like this post? Like us on Facebook for the next one in your feed.

